How To Improve Network Performance | How To Analyze Network Performance

For a problem-free network performance, we normally ensure that the cable connections are intact, the network cards do not conflict and data communication is working. However, beyond these minimum expectations to ensure the network hardware and software are working, there are other parameters that we need to monitor or analyze for better network performance, such as:
1) Data read and written to the server per second
2) If you use Ethernet technology, the number of collisions per second
3) The commands in queue
4) Security error messages
5) Failure to access data
6) Network performance
7) Currently maintained server sessions
8) Network statistics


Data Reads and Writes To The Server
The amount of bytes read from and written to the server is a good measurement of the server’s activity. If the value increases over time, we will need to monitor whether it is significantly affecting the network and server performance. System configuration may need be adjusted to handle the increased server workload.
Recommended Networking Books

Collisions Per Second
If you are using Ethernet technology where the access method uses CSMA (Carrier Sense Multiple Access), collision in the network is normal. In many cases, collision rates of 50 percent do not cause a large decrease in throughput. The upper limit or the maximum acceptable percentage of collisions is usually around 70 percent. When this upper limit is exceeded, your network can become unreliable. High collision rate is a sign of network congestion; it slows down the entire network, packet loss is experienced, and it significantly reduces the network efficiency.
Under CSMA access method, only one node on the Ethernet segment can transmit at one time. When more than one node attempt to transmit concurrently, collision takes place and the data transmitted by both parties are corrupted, and need to be re-sent again after a random amount of time lapses. Even though the time to resent is fairly short after the first failed attempt, it increases exponentially with each additional failed attempt. Since random amount of time is waited before the resend, it is unlikely for two stations to repeat the same collision on the second attempt. However, if there are many stations on the network, the chances of multiple collisions increases, data transmission is delayed and network throughput is then significantly decreased.
The rate of network collisions per second indicates the effectiveness of your network’s physical topology design. On an Ethernet network, all the nodes in the network will listen to make sure the lines are clear before transmitting data. High network collisions can be caused by lengthy network segment, where one node from one end takes longer time to ‘hear’ another node that has started transmitting at the other end.
Too many repeaters installed between the sending and receiving computers will cause significant delay in data transmission between the sender and receiver. Before the data can be heard in time by the receiver, another data is transmitted, causing collision.
The most common reason of high collision rate is due to too many workstations transmitting huge amount of data on a single network segment.
In this case, it is recommended that the network is redesigned using switches, bridges, or router into a few network segments with fewer stations. Switched technology allows multi transmission or conversations on the network without causing collision.
Faulty device such as network adapter, switch, and hub that do not listen before transmitting data can also increases the collision incidence.
Queued Commands
Queued commands are the commands waiting to be executed in the server. It is a good measure of server’s traffic. As a rule of thumb, the number of queued commands should not exceed the number of network cards in the server or you will have a bottleneck problem.
Security Error Messages
A high occurrence rate of failed logon, failed access or failed attempt to modify security settings may indicate a security risk on your network. A user might be attempting to use an application which she has been denied the access or a hacker might be attempting to break into the system. Either way, the errors are something to watch for. You may want to consider employing a protocol analyzer that can capture the network traffic, create reports and graphs from the data collected. It helps you to find the source of errors, or spoofing attack where an unauthorized person or program successfully masquerades as another authorized person by falsifying data and thereby gaining an illegitimate advantage in the system.
Server Sessions
You can monitor the server activity by monitoring the server sessions. Details such as the slow connection rate from client to the server and client disconnection method may tell you something. Connection can be terminated by user normally or abnormally due to errors, or server time out. The latter and slow connection rate to the server may indicate that the server is overloaded, refusing unauthorized access, or fail to serve the requests fast enough. You may want to increate the server’s RAM to solve the problem or update the server or network hardware.
Network Performance
If your network computers operate using Windows NT, Windows 2000 Server, Windows XP or Windows 7 or the latest operating system, there are three tools you can use to monitor your system performances, namely the Event Viewer, the Performance Monitor, and the Network Monitor.
Event Viewer
Under Event Viewer, you can monitor your system and network performances from System Log, Security Log and Application Log. The Security Log is a very useful auditing tool to check for failed attempts to logon or access data in the system. The System Log records events by Windows system components, therefore provides basic information and status of operating system services. For example, using this System log, you can check whether the newly installed network card is working. If there is an interrupt conflict, it will be recorded. In the Event Viewer, you can get an overview of all the services to see if they are running, and you can also monitor whether a particular service has stopped or started.
Event Viewer

Performance Monitor
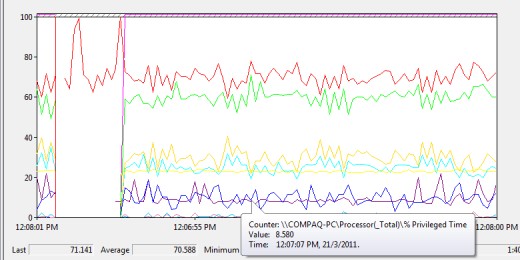
Performance Monitor is a very useful tool to record and view performance in the form of trends. It keeps track of certain counters for system objects, which is a portion of software that works with other portions to provide services. This tool can be started in the menu hierarchy “Start”, then “Programs”, “Administrative Tools”, “Performance”.
For your server monitoring purposes, you can “Add Counter” by right click at the bottom of the graph where the legend is, to add objects that you want to monitor for performance. You may want to consider collecting data for the following system objects:
1) Processor
2) Memory usage
3) Logical or physical disk usage in the server
4) Any of the protocol counters such as IP packets per second
5) Redirector
6) Server work queues
Monitoring these objects will give you some ideas on where system bottlenecks occur and what hardware needs to be upgraded. You can take a snapshot of the system behaviour during normal load, known as baseline, and monitor your system performance based on this baseline for abnormality or unusual situations.
Note : Running this Performance Monitoring takes up resources which may slow down your server. If you need to use it, it is better to monitor a server remotely, for example from a Windows 2000 Professional computer. This action will increase network traffic, but the degradation of server performance will not be as severe as running the Performance Monitor directly from the server being monitored. It is the user interface portion of running Performance Monitor that requires recourses, not the gathering of counter data for performance Monitor objects.
Performance Monitor


Network Monitor
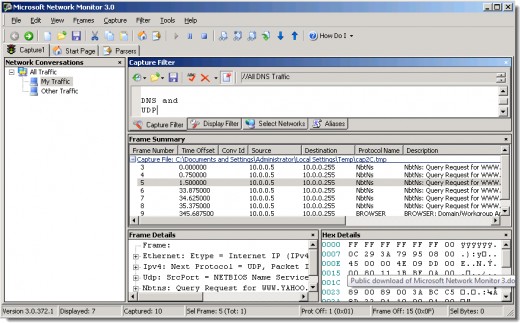
Network Monitor is a software-based protocol analyzer that can capture network traffic, create reports and graphs from the data collected. It records the source address, destination address, headers and data for each packet, as many frames as it can fit in physical memory of the system with 8 MB free for other programs. You can perform data filtration to narrow down your monitoring, based on transport protocol, by source or destination address, or by data pattern.
Note : Unlike Event Viewer and Performance Monitor, the Network Monitoring tool is not part of the standard installation during Windows setup. It must be installed separately as a network service. You can install the tool from the Server distribution CD-ROM.
Network Monitor
Network Statistics
Network statistics can be gathered from Performance Monitor or the Network Monitor tools on a Windows system. In Performance Monitor, you may want to obtain the statistics from Network Interface to keep tracks of data read from or written to the network. Network Monitor can track the same data but displays also the error rates, allowing you to investigate individual packets or errors.
Monitoring the network utilization rates in Network Monitor or Performance Monitor will give you a rough measure of network’s health. The healthy utilization rate varies from one network technology to another. For instance, an average 80% utilization rate for token ring network is acceptable while the same rate is too high and unacceptable for an un-switched Ethernet network. Note that for Ethernet network, significant data collisions will take place if the utilization rate goes beyond the 60% range.

Related Topic
- Network Planning and Implementation - What You Need ...
A well-run network is staged like a smooth running car where the users only notice they can manoeuvre the car comfortably; they dont notice the thorough project management, the design, planning and... - Network Troubleshooting Guide - What You Should Chec...
To troubleshoot network problems, the first question you should ask is, Has this piece of equipment or has this part of network ever worked properly before? If the answer is yes, then the next question... - Free Network Troubleshooting Tools
Unfortunately, network troubleshooting process does not always end with a solution. The information we gather from users or while troubleshooting a network problem can sometimes lead us to another problem...
Related

Network Planning and Implementation - What You Need To Consider in Network Project Management

Basic Differences Between Category Cat5e, Cat6, Cat6e and 6a Network Patch Cables

Why the Internet was Created?

Tools for techs - Ethernet Network Cable Tester

How to Make Your Usb Drive Virus Resistant - Part 2